Digital Experience KPI Analytics Dashboard

Are you looking for a way to proactively monitor DX server health, device events, or trending device behaviour? Introducing Incognito’s new add-on module to DX – the KPI Analytics Dashboard. Powered by Elastic Stack and Kafka, this highly customizable module allows the operator to focus on data that matters to you.
What is KPI, and why is it right for me?
KPI (Key Performance Indicators) is a type of performance measurement, used to evaluate success and to assess the performance of the system. A KPI dashboard will show live data which is implemented as a graph or numeric value, and with customizable thresholds, visible warnings can be triggered in the panel to alert your technicians proactively.
Example KPIs
Gain a better view of your device network health, such as Device Inventory:
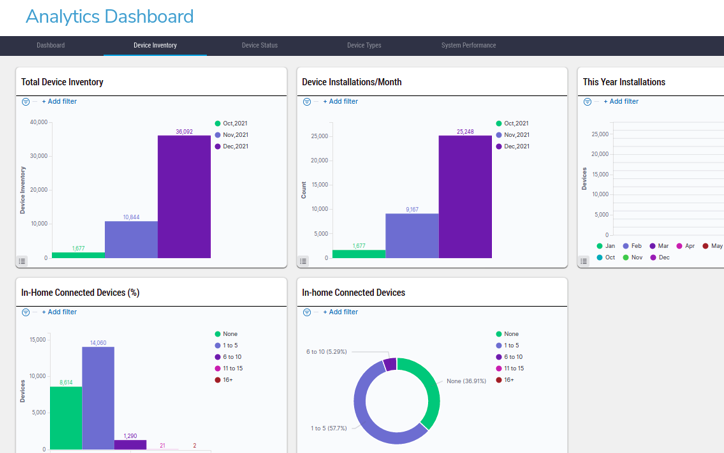
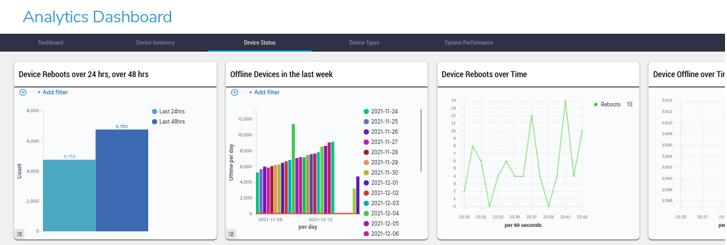
Current Device States:

Or Device Activity:
Improved Monitored Parameter Collection
Current users of DX may be familiar with Monitored Parameter and Trending Value data collection – the ability to collect and write device parameter values to an external database. There were limitations on this functionality however – the frequency at which data could be collected, and the ability to visualize this data. With KPI, administrators now can split the device inform from the data collection inform and collect the data over Kibana. This new feature adds visualization of this trending data right in the device record, giving your CSRs a more powerful troubleshooting tool.

Please sign in to leave a comment.
Comments
0 comments